

The Reordering To AI/HPC: TSMC's 2026 Outlook and Beyond
Setting the Stage: TSMC’s 4Q25 Earnings Confirm the Thesis

TSMC’s 4Q25 results confirm what we have been saying for months: the AI infrastructure buildout is not slowing down, and TSMC sits at the center of it. Revenue of $33.7B beat the high end of guidance. Gross margin of 62.3% exceeded the guide by over 100 basis points. Management guided to close to 30% USD revenue growth for full-year 2026, implying approximately $159B against consensus street expectations of $152B heading into the print.
The longer-term outlook revisions are equally bullish. The five-year revenue CAGR target moved from 20% to approximately 25%. AI accelerator revenue guidance shifted from mid-40% CAGR to mid-to-high 50% through 2029. Long-term gross margin expectations lifted to 56% and above. These revisions reflect management’s increasing confidence in AI demand durability, confidence that came, as CEO C.C. Wei noted on the call, from spending months talking to customers and their customers’ customers about whether the AI buildout is real.
Wei shared his conclusion that demand is in fact real, though he also acknowledged what everyone who has covered this industry for more than a decade knows: the historical cyclical nature of semiconductors makes him nervous. We share that awareness. The cyclicality of this industry is well documented, and while we see structural differences that suggest this cycle extends longer than prior ones, wisdom in capacity buildouts remains essential to avoid an overbuild scenario.
The Execution Is Undeniable
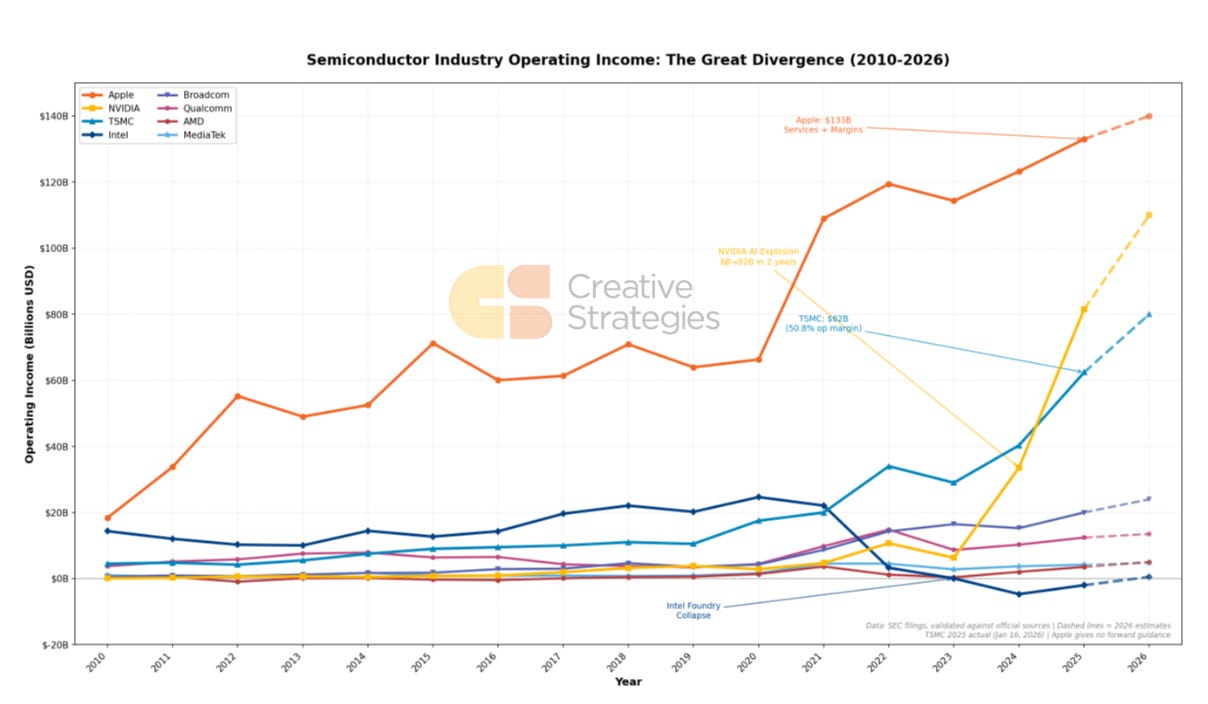
Set aside the cyclicality concern for a moment. TSMC’s execution is exceptional. Gross margins above 62% from a foundry remain remarkable. These are numbers we associate with Nvidia and Apple, not capital-intensive manufacturing businesses. Operating margins are tracking Nvidia’s trajectory. Revenue exceeded $100B for the first time in 2025 and now guides to nearly $160B in 2026. The value capture here is unlike anything the foundry business has seen.
The Margin Story
The margin expansion includes pricing power, though that tells only part of the story. The structural tailwind comes from node lifecycle economics. N3 is now in years three and four of meaningful sales contribution, scaling from approximately $25B to $40-50B annually. Like prior nodes, this is when margins inflect. In years one and two, yields are poor and the node barely breaks even. By years four and five, yields have matured, capex has depreciated, and the node becomes a margin engine. N5 is now in years four and five at roughly $20-27B, fully contributing to profitability. Meanwhile, N7 and trailing edge nodes including N16, N28, and N40 provide stable $5-8B annual revenue streams with mature economics.
The mix shift toward HPC, which represented 55% of Q4 revenue, adds to this dynamic. AI accelerators on N3 and beyond carry premium ASPs, and the constraint environment means TSMC can be selective about which demand it serves.
The Customer Reordering
For over a decade, Apple has not only been TSMC’s largest customer but also their most strategic. In many ways, TSMC is what it is today because of Apple. However, a shift happens in 2026 perhaps on both fronts for TSMC. Our model projects NVIDIA generating ~$33B in TSMC revenue, representing 22% share, versus Apple at ~$27B and 18.0% share. The crossover reflects divergent growth trajectories: NVIDIA at 47% year-over-year growth, Apple at 20%.
This shift to larger chips and HPC workloads introduces fundamentally new economics for TSMC. NVIDIA’s products carry different margin profiles, capacity requirements, and packaging intensity than Apple’s. A customer base led by AI accelerators rather than smartphone processors changes how TSMC allocates capacity, prices advanced nodes, and prioritizes packaging expansion. We quantify these dynamics across TSMC’s top 10 customers in the full report.
Broadcom’s trajectory stands out from both a revenue and wafer demand perspective. Revenue is projected to reach ~$12.B in 2026, up 132% year-over-year, driven by Google’s TPU ramp. Broadcom moves from seventh to fourth position in TSMC’s customer ranking, ahead of both Qualcomm and Intel (who was briefly in the top 5 thanks to fully using TSMC for most products). Broadcom has the highest year-over-year increase in wafer demand of any customer, which demonstrates the forward commitment of Broadcom, its understanding of custom silicon demand, and the continued commitment to scale custom silicon as a fundamental strategy for the hyperscalers. We view this as one of the most important dynamics to watch over the next several years.
The Constraint Reality
TSMC’s revenue growth is ultimately bound by manufacturing and packaging capacity. Expanding that capacity is capex intense. Each new fab represents roughly $30 billion in construction, but that investment sits atop hundreds of billions in cumulative R&D that enables leading-edge process capability. This is the structural barrier that limits both TSMC’s near-term upside and competitive entry. But also something strategic customers can help alleviate.
Our estimates suggest a 20-25% (possibly conservative) wafer deficit relative to unconstrained demand. While admittedly a difficult exercise, we modeled several scenarios and estimated that TSMC could use three or four new fabs just to meet current demand. The question that keeps TSMC management cautious is whether those fabs stay full four years from now. Fabs running below 75-80% utilization lose money. The $52-56B capex commitment for 2026, with 70-80% going to advanced technologies, is a statement of confidence but also a bet that this demand persists. We view TSMC’s approach as reasonable: build capacity believing it will remain utilized, but do not overbuild into uncertainty. More on this in our Intel report, but we view the demand gap as opportunites for another foundry.
CoWoS advanced packaging remains the binding constraint. As Wei said on the call, they are working very hard to narrow the gap. Having toured Intel’s advanced packaging facility, we can say directly: this is not like printing wafers with monolithic dies. Every tile has to be assembled, tested, and integrated. The automation challenges are immense. This bottleneck does not ease quickly, and we do not expect it to resolve before 2028 at the earliest.
What the Earnings Resolved
Resolved: AI Demand Has Not Peaked
Management’s commentary is another, of many, bullish signals. CEO C.C. Wei stated that AI is real and starting to grow into our daily life and under penetrated in the enterprise. Q1 2026 guidance of $34.6-35.8B implies 38% year-over-year growth at the midpoint, an acceleration from Q4’s 34% pace. The raised AI accelerator CAGR guidance of mid-to-high 50% versus prior mid-40% indicates management sees stronger demand visibility than three months ago. We develop a bottom-up datacenter AI revenue model in the full report projecting 57% CAGR through 2029, from ~$12B in 2024 to ~$114.B. *Model will be updated thoughrout the year and any structural changes shared in our analysis.
Resolved: Margins Are Expanding, Not Contracting
The margin debate tilted decisively toward the bulls. Q4 gross margin of 62.3% beat guidance by over 100 basis points. Q1 2026 guidance of 63-65% gross margin implies further sequential expansion, not the compression skeptics anticipated from N2 ramp costs and overseas fab dilution. Management raised long-term gross margin guidance to 56% and above, indicating confidence in structural margin improvement. We detail the margin bridge and quarterly trajectory in the full report.
Open Question: Capacity Constraints
Despite contributing to approximately 10% of revenue, CoWoS advanced packaging remains the binding constraint. This is why it remains a key metric we are tracking. Capacity expands roughly 70% year-over-year through 2026, but demand continues to outpace supply by 15-20%. As Wei said on the call, they are working very hard to narrow the gap. We do not expect this gap to close in 2026.
Open Question: N2 Ramp Trajectory
N2 began mass production in 4Q25, and management confirmed it is on track. The 2026 capex guide of $52-56B, up from $40.9B in 2025, with 70-80% allocated to advanced technologies indicates aggressive N2 capacity build. Our model projects $8B N2 revenue in 2026, scaling to $36B in 2027. The full report compares N2 and N3 trajectories and customer adoption timing. We expect N2 to follow a similar margin progression to N3, with meaningful profitability contribution beginning in 2028.
What Subscribers Get in This Report
The sections below provide the detailed models, data, and analysis supporting the projections outlined above. This subscriber report will be broken into two parts. Full report contents:
1. Customer Revenue Model Deep Dive — Complete breakdown of TSMC’s top 10 customers with 2025-2026 revenue projections, share evolution, and growth decomposition. Includes the NVIDIA-Apple crossover analysis, Broadcom’s TPU-driven growth, and second-tier dynamics across AMD, Qualcomm, and Intel.
2. N3 Capacity Allocation Analysis — Triangulated wafer allocation data by customer for 2026. Apple’s 37% N3 share, NVIDIA’s accelerating run rate, and the migration patterns signaling N2 adoption timing.
3. Datacenter AI Revenue Forecast — Bottom-up model with GPU/accelerator unit assumptions, die size evolution, wafer pricing trajectory, and the new HBM logic base die revenue stream through 2029.
4. Advanced Packaging Capacity Trajectory — CoWoS expansion and the persistent supply gap analysis, and the customer allocation framework, determining who gets capacity.
5. N2 vs N3 Ramp Comparison — Node transition economics showing N2’s faster adoption curve ($8B to $36B in one year), customer timing, and the compressed N3 revenue window.
6. Quarterly Earnings Model — Granular 4Q25-2Q27 projections with revenue seasonality, margin trajectory, and the catalysts that drive quarterly stock reactions.
7. Capex Cycle Analysis — $48B 2026E breakdown by category (advanced logic, packaging, specialty), geographic allocation, and investment intensity metrics supporting capacity growth projections.
8. Competitive Position Assessment — Intel Foundry viability, Samsung’s declining share, and the ecosystem lock-in dynamics that make customer defection structurally difficult.